This Quiz Section uses online tools to analyze thousands of MS/MS spectra at once. We will use the The GPM Software to perform database searching online.


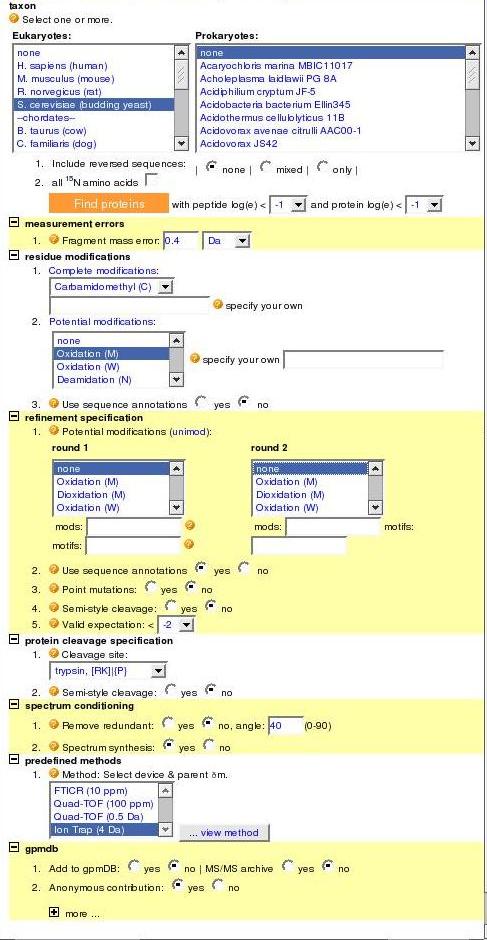
On the right is the main search tool, available from The GPM website when you click on "Genomes". Below, are descriptions of each section
  • 1) Click the "Browse" button to upload a file from your computer. We will be using .dta data files linked to this webpage.
  • 2) Here you can select one or more organism protein databases to search. For this tutorial, we will use yeast (S. cerevisiae). Also note that the "Find models" button in this section is used to start your search - But we have to finish putting in our parameters first!
  • 3) The measurement error represents how much error we allow in our y- and b- ion calculations. Leave it set to 0.4 Da
  • 4) Residue modifications are caused by the chemicals used in preparing our sample. We used iodoacetamide (IAA) to prepare the samples, so we expect to find carbamidomethylation. We can also specify oxidation of other amino acids, such as methionine, but for the purposes of this quiz section, you can set all potential modifications to none.
  • 5) Set all these modifications to none as well. Set point mutations and semi-style cleavages to "no".
  • 6) We used trypsin to digest our sample, so make sure the trypsin cleavage site is selected. Set semi-style cleavage to "no".
  • 7) Ignore this section.
  • 8) This section specifies what type of mass spectrometer was used. For all the data in this quiz section, we used an "Ion Trap".
  • 9) This section allows us to add our results to the GPM database. Since the results are in there already, you can set the anonymous contribution to "yes" and all other fields to "no".


Data analysis is fairly fast on The GPM (the wait time is usually the uploading stage).

You can navigate through your results by clicking on the arrows indicated in the red circle.

You can rank your results by clicking on the column headers in the red rectangle. log(e) and log(I) are scoring functions, % is the percent of the protein sequence identified by peptides, # is the total number of unique peptides found for a protein, total is the number of MS/MS spectra that represent a protein, and Mr I have no clue.

You can change how you view your output by clicking on the display toggle indicated by the red arrow.

If you click on "protein" next to any database match (blue arrow), you get a page similar to the one below:

This page lists the protein sequence and where your peptides match the sequence. It also give individual scores for the peptide matches. You can click on any of the peptide sequences in the list to see the MS/MS spectrum that gave rise to the peptide ID:


Example #1: Yeast Data Analysis

Download this file: yeast.dta - Note: you might have to right-click and "save as".

This is a compilation of fragmentation spectra from a tryptic digest of Saccharomyces cerevisiae. Do a database search on the MS/MS spectra using The GPM, and answer the following questions:

1. What are the top 5 proteins with the most number of unique peptides?
2. Which 5 proteins have the highest peptide coverage?
3. Which protein had the most fragmentation scans?
4. What is the most N-terminal peptide identified in the protein from question #3?
5. What is the charge state of the peptide from question #4?


Homework, Due Monday 5pm

[homework key]


Data files: Note, you might have to right click the links and "save as"
Data file #1
Data file #2

The data files are two SCX fractions from a MudPIT analysis of E. coli strain K12 substrain Mg1655. Open two browser windows and search each data file using The GPM. You will compare the results of each fraction to answer the following questions.

1. List the top 10 proteins with the highest number of unique peptides from data file #1. (for ties, give the best e-value)
2. List the top 10 proteins with the highest number of unique peptides from data file #2. (for ties, give the best e-value)
3. How many proteins are shared between the top 10 proteins of the two fractions?
4. Did dividing our sample into two fractions, which doubles the number of MS/MS scans we can obtain, double the number of proteins identified in our top 10? Why or why not?

Find membrane-bound ATP synthase, F1 sector, beta-subunit (gi|16131600) in each sample and answer the following questions:
5. What percent of the protein was covered in data file #1?
6. What percent of the protein was covered in data file #2?
7. How many peptides are shared for the protein between data file #1 and data file #2?
8. How has dividing our sample into two fractions improved our ability to identify this protein?

Submit your answers by email to maxboeck@u.washington.edu
Please just type your answer in the body of the text (do not send word documents or attachments).