Quiz section six will teach some basic concepts in microarray data analysis. In particular, this quiz section will focus on clustering of genes with similar expresion patterns and discovering what their conserved function is. The two website we will be using are SMD and YeastDB's GO term finder.
Accessing Data
Perhaps the best place for accessing microarray data is the Stanford Microarray Database ( SMD). This is where we will be getting the data for todays quiz section.
Today we will be looking at data from one of the original mircroarray papers. The data was generated to examine those genes important for yeast cell cycle regulation.
Cells are arrested prior to exit from G1 and the released in a sychronous manner. Genes that are involved in cell cycle will have a typical on-off-on-off pattern.
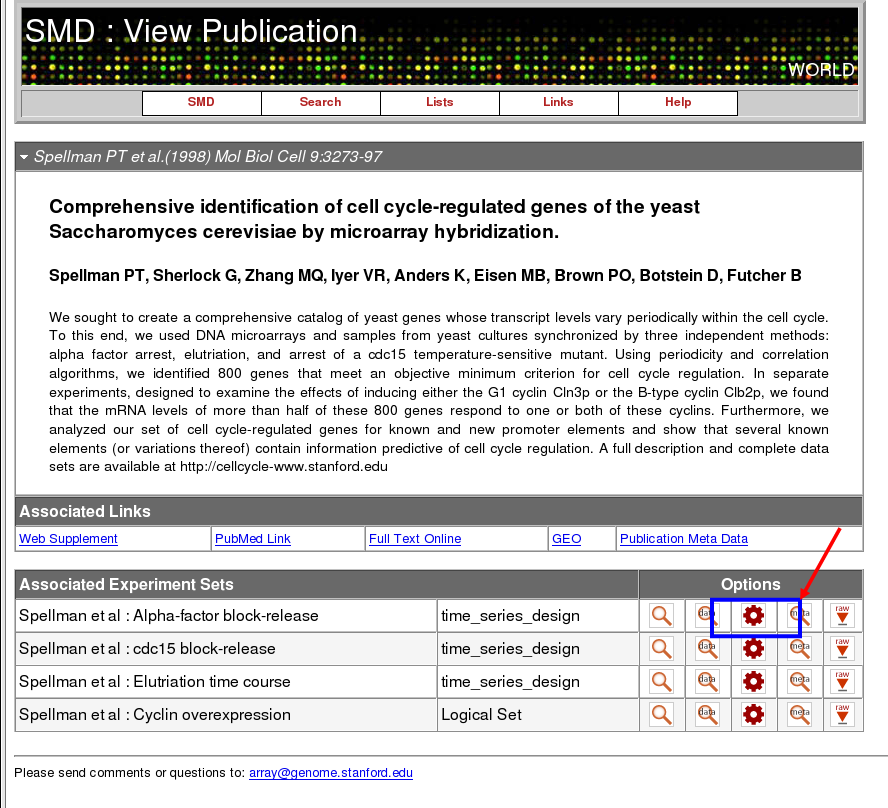
There will be a lot of pages we will have to go through to get to the data, but with the exception of the "Gene Filtering Option" page all you have to do is go to the bottom of the page and click proceed. Go to Spellman Experiment.
.
Start by clicking on the "data retrieval and analysis" button (it looks like a gear):
Advance Search
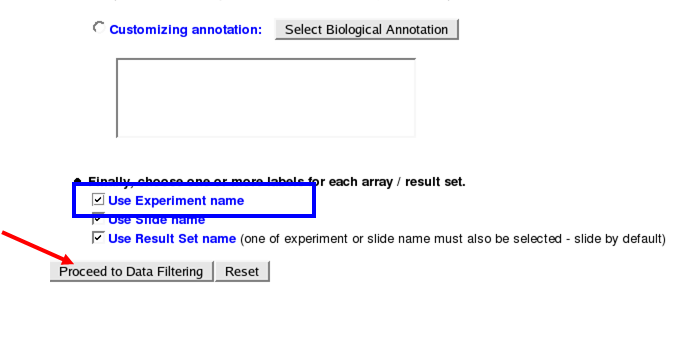
On the next page be sure to scroll down and turn on "Use Experiment name" then proceed:
Data Filtering
Click "Retrieve Data" to proceed and wait......wait....wait.....scroll down and click to "Proceed to Gene Filtering"
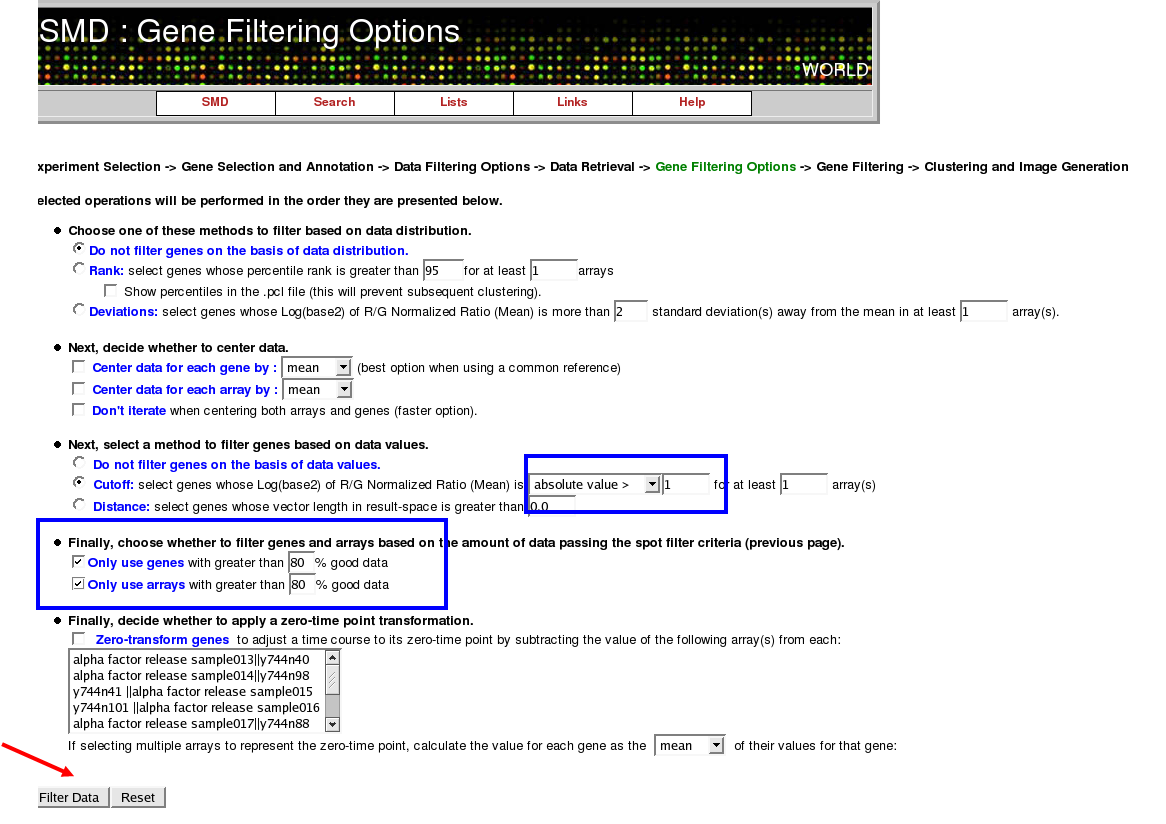
Gene Filtering
The two things you should change here are the cutoff and the filtering options. The Cutoff is located in the third section on the page; change it to a cutoff of 1 rather than 2 (note this can be oddly tricky so pay attention in class). Next turn on the two cutoff options allowing only good data to be used (this is important given that these experiments were done before the kinks were worked out of microarray hybridization):
Click "Proceed to Clustering" on the next page.
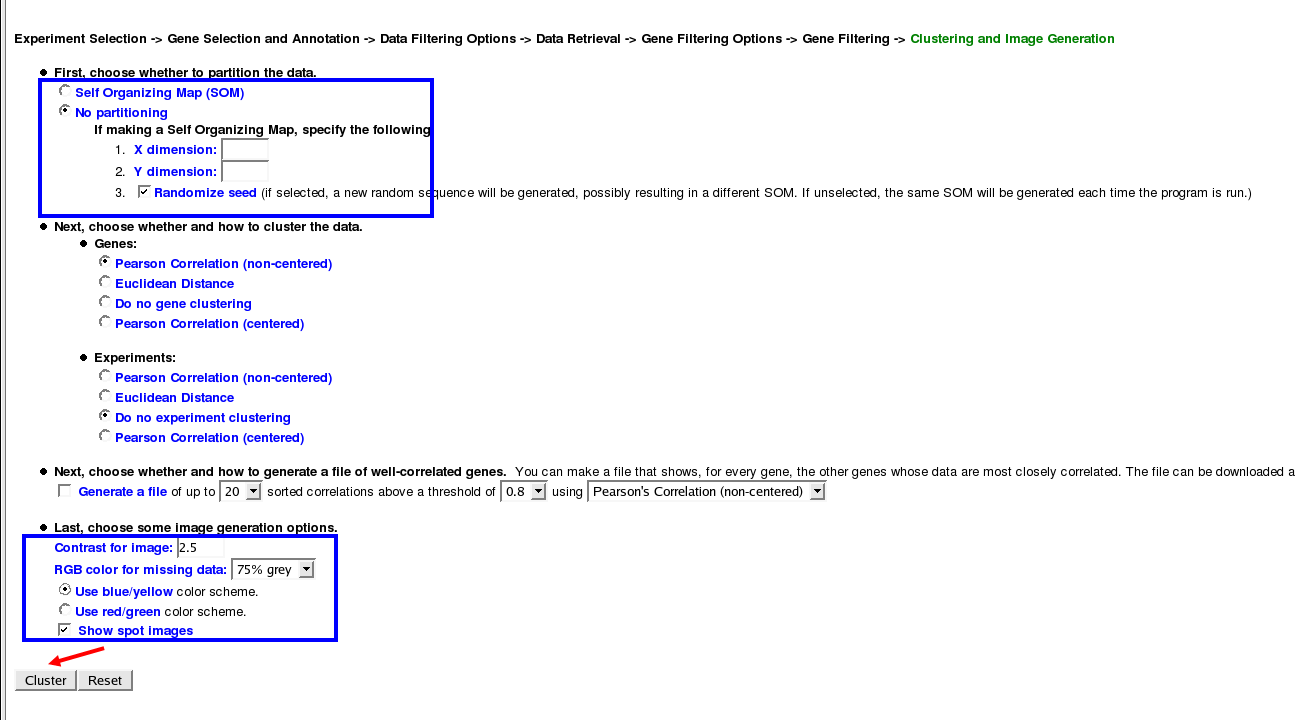
Clustering and Image Options
For now I am not going to partition the data, but I recomend trying to partition the data and seeing what the data output looks like for yourself. Other than that I like to change the coloring scheme to blue/yellow rather than red/green:
DATA!!!!
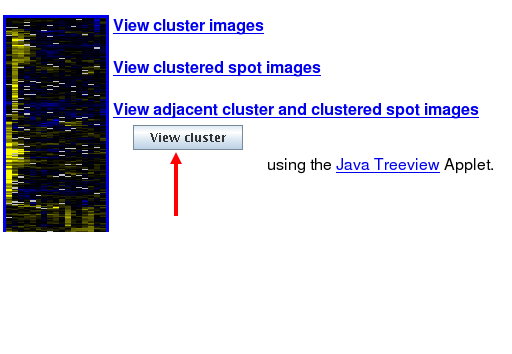
What we now have is display of the clustered data. Moving left to right we have the progression of time, moving up and down we have individual genes and their expression. Note that straight away you can see that there are stripes of genes that have expression that changes as the yeast progress through the cell cycle (red or yellow is an indication of expresion, blue or green is an indication of repression relative to control). I highly encourage you to click on "View adjacent cluster and clustered spot images" you can see not just the clustering, but the original spots that the data was generated from. Click on "View Cluster" to bring up an interactive java view of the data:
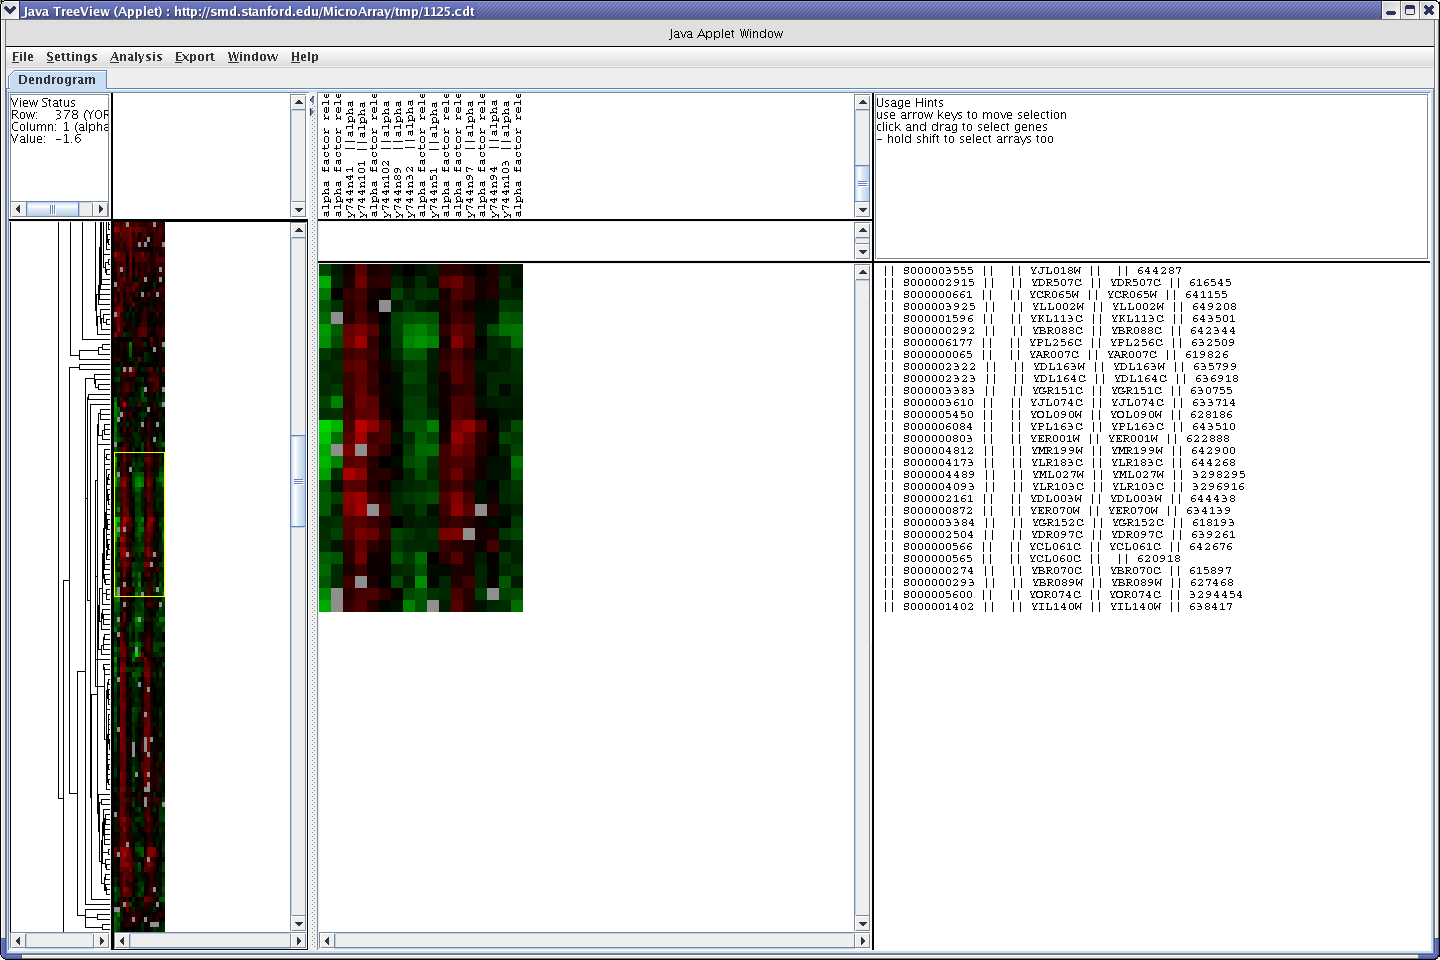
Java Treeview
What we are going to do is cut and paste genes that have been clustered together as having similar expression patterns into yeastdb's Gene Ontology Term Finder . This will allow us to see if genes that are correlated in expression are correlated in annotated function as well. To do this select those clustered genes that you are interested in in the Java tree viewer.
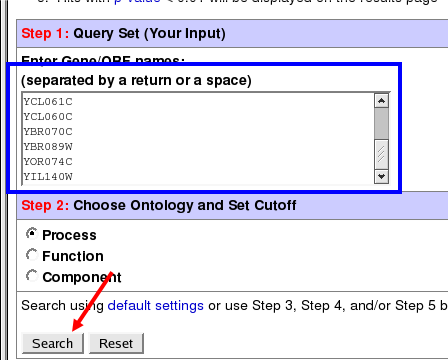
Yeast DB
Click on "Export" and the "Export List" option in the java treeviewer. You can either save this list and upload it into yeastDB or copy and paste into yeastDB (I prefer the latter for anything that you don't want to keep). Paste or upload the list of genes into the GO term finder and click "Search".
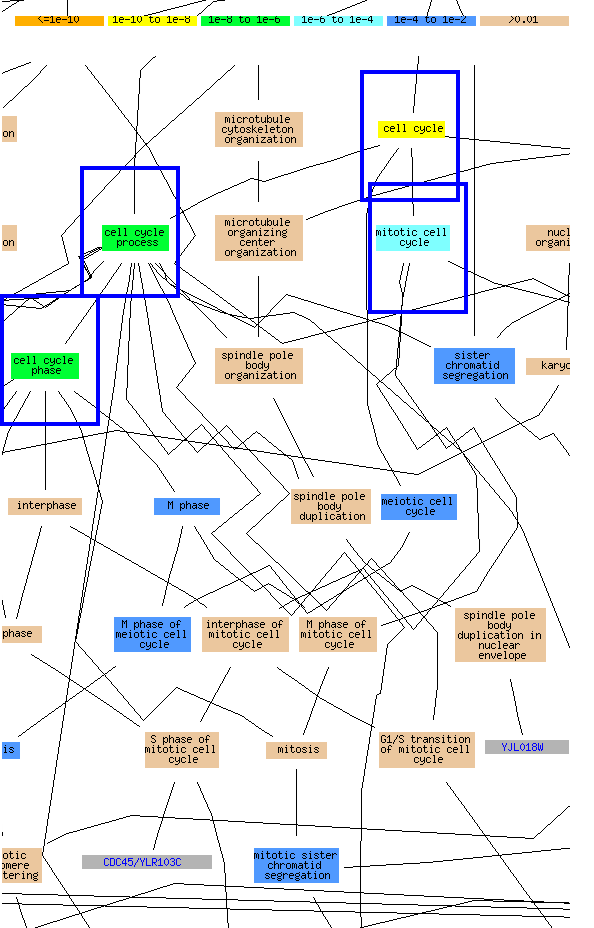
GO data
The data that comes out of the GO search can be confusing. Just realize that the display shows all the cellular processes and how they are linked. Those GO terms enriched in the list that you gave yeastDB are then highlighted with the color corresponding to the particular p-value for the enrichment. Note those that I searched were highly enriched for cell cycle regulation (YAY!):
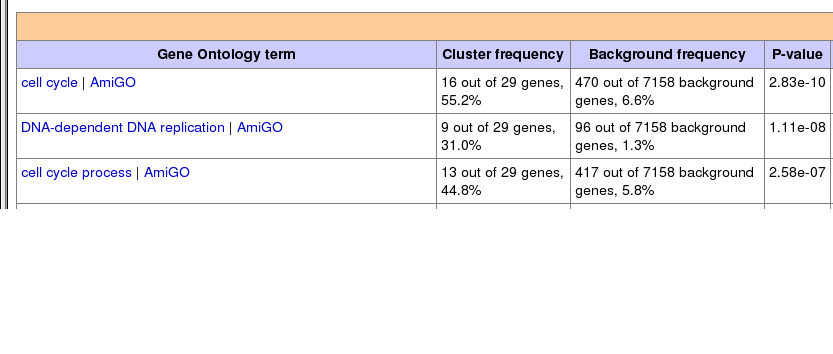
You can also scroll down to get a more details output of the data:
Questions:
1) Select the first 30 odd genes. Is there any enrichment for a particular set of GO terms when you search against yeastDB? If there is, what is the best hit, if not what are the reasons?
2)Look at the genes located about half way down that have a cyclical pattern their regulation. Is there any enrichment for a particular set of GO terms when you search against yeastDB? If there is, what is the best hit, if not what are the reasons?
3) What about the cluster of genes found about 3/4 of the way down?
HOMEWORK
1) Start by reexaming the previous alph-factor release data. If you limit the cutoff to 2 (gene filtering options) what happens to the number of genes? Can you still find enrichment for genes involved in the cell cycle? What Genes are they?
Using the data set from the cdc15-release data set try and find a cluster of genes enriched for cell cycle regulation and replication.
2) Show me the table of the top ten scoring sets of genes from your GO term finder analysis (by p-value). If there are fewer than ten, just give the top p-values.
3) Why did they do three different experiments (alpha factor release, cdc15-release and elutriation) to examine the same phenomenon? Try to imagine what would be different and what would be the same and why.